
A couple of hours ago I saw a Facebook thread where someone posted some impressive graphics that made it appear that the East Baton Rouge Parish School System (EBRPSS) performs poorly when compared to Zachary and Central. When I pointed out that School and District Performance Scores were essentially a measure of school poverty, he demanded that I show him the data. So I did, a couple minutes after he signed off for the night.
Rather than waste the fifteen minutes I spent making this graph on the bottom of a thread that will quickly fade from view, I thought it might be appropriate to put it here, so I could reference it whenever I have that same discussion with someone who is under the impression that EBRPSS schools don’t compare well with other districts in the state. The graph below is no great revelation; other people have been creating and sharing similar graphs for years.
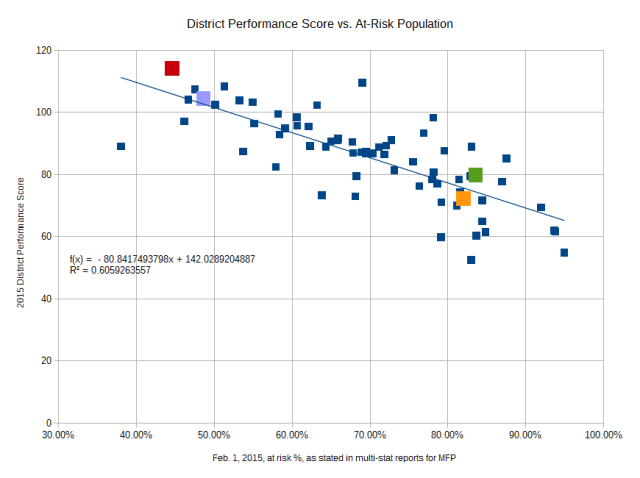
I collected from the Louisiana Department of Education web site the District Performance Scores for District Performance Scores for 2015 and the February 1, 2015, district-level MFP membership data. I graphed the at-risk percent on the x axis and the District Performance Score on the y axis, and then used my spreadsheet to find the best linear fit.
R-squared for this regression is above 60 percent. I think most reasonable people would agree, looking at the data points above, that low percentages of at-risk students tend to be associated with high District Performance Scores, and high percentages of at-risk students correlate with lower District Performance Scores.
The District Performance Scores are a hodgepodge of poorly-constructed component metrics. They don’t take into account, in any stable or meaningful way, the amount that a student’s performance improves in a year. So a school that brings someone from four years below grade level to fully proficient in one year gets a lower rating than a school that accepts a high-achieving kid who simply coasts and maintains his percentile ranking. Unfortunately, that’s the quality of data supplied by state Superintendent of Schools John White and his staff.
Back to the Facebook argument — the one regarding the relative quality of the four school districts within East Baton Rouge Parish: Zachary (red square) is above the trend line, but so is EBRPSS (green square). Central (violet square) is just barely above the trend line, and Baker (orange square) is slightly below the line. But compared to the difference explained by the at-risk percentage? Those distinctions are minor. Perhaps it would make more sense for us to work together to raise educational for opportunity for all students in the state (rich, poor, gifted, disabled, male, female, black, white, tall, short, . . .) rather than engaging in the reformers’ game of destructive competition.

Agreed. And the fit between scores and poverty gets even tighter if you removed the Progress Points (aka Bonus Points) which are assigned through a mysterious and highly unstable VAM.
http://louisianaeducator.blogspot.com/2016_01_03_archive.html
Pingback: The False Premise of Voucher Hype | Methodical, Musical Mathematician's Musings